
Scoping Document
6. Future mineral need and provision
Introduction
6.1Within this chapter, we will set out how the Plan will ensure a sufficient supply of minerals to meet Nottinghamshire’s demand over the 15 - year plan period.
6.2Through consideration of the requirements set out in the NPPF, we have established a potential structure for this chapter and wish to seek your views on this as well as specific issues which are vital to shaping the Plans policies in the future
NPPF requirements
6.3As set out in Policy M1: Planning for a sufficient supply of minerals of the NPPF, the key purpose of the minerals Plan is to ensure a sufficient and timely supply of minerals to meet Nottinghamshire’s demand over the Plan period.
6.4The policy sets out that the plan should do this by establishing the amount of minerals needed. How to calculate the demand and amount of minerals needed is different for aggregates and industrial minerals.
6.5To determine the demand for aggregates, clause 2 of policy M1 details provision should be identified by considering:
- The Local Aggregates Assessment (LAA), which considers:
- 10 years sale average
- 3 years sales average
- Other relevant local information
- The advice of the Aggregate Working Parties
- The advice of the national aggregate co-ordinating group, as appropriate
- Any published National and sub-National guidelines on future supply
6.6A draft LAA containing the latest sales information (2025 sales) for aggregates in Nottinghamshire has been published with this consultation. It outlines this key information, and we will seek feedback from the aggregate working party and national co-ordinating groups through this consultation.
6.7It is also key that a 7 – year landbank for sand and gravel and a 10 – year landbank for crushed rock is maintained.
6.8For industrial minerals, clause 3 of Policy M1 states the level of provision needed must be based upon evidence of existing site capacities and demand. It also sets out the level of reserves that should be maintained through the Plan for silica sand and brick clay.
6.9For both aggregates and industrial minerals, the established level of need should be met through the allocation of sites and/ or preferred areas.
6.10Clause 6 of Policy M1 is also clear that the plan policies should consider how substitute or secondary and recycled materials can contribute to supply. Their use is preferable to the extraction of primary materials.
Structure of chapter
6.11Considering the requirements set out in Policy M1 of the NPPF and that each mineral will have a different demand, we propose this chapter is structured into sections for each mineral found in Nottinghamshire. Each section will then follow the structure of:
- Policy identifying the amount of mineral needed
- Policy on meeting this need, including identifying site allocations and/ or preferred areas or having a flexible policy if no allocations
- Policy or policies for allocations relating to site specific issues
6.12It could be that the policy for identifying mineral need and meeting this need may be collated together where appropriate.
Question 10: Do you agree with the structure of the future mineral need and provision chapter? If not, please provide an explanation and example of what you think this chapter should contain. Comment
6.13In relation to the allocation site-specific policies, currently the adopted Plan provides a site development brief for all allocated sites, with the policy requiring applications to be made in accordance with them.
6.14However, we wish to convert these into site-specific policies. This would mean each allocation site would have its own sub policy which would support the delivery of the allocation. As per Policy PM2 of the NPPF, the policies would set out clear expectations of what is required from any application for the site, identifying key issues that would need be addressed when an application is made.
6.15This would cover a range of topics, including the natural environment, historic environment, landscape, local amenity, specific road networks as well as potential restoration ideas and priorities.
Question 11: Do you agree with having site specific policies for allocated sites instead of site development briefs? If yes, what topics should the policies cover? Comment
6.16At this early stage, no policies for this section have been drafted. However, there are specific issues around establishing need and how to meet it for each mineral that we want to seek your views on. These are detailed below by each mineral.
Sand and gravel
6.17Sand and gravel is a key aggregate within Nottinghamshire and is the main aggregate produced. Ensuring we establish adequate provision and that we maintain a landbank of at least 7 years[2] is crucial to developing a sound plan.
Establishing sand and gravel need
6.18The policy in this section will establish the estimated demand for sand and gravel over the Plan period (up to 2045). This will be similar to Policy MP1: Aggregate provision in the current adopted Plan.
6.19To calculate the estimated demand and amount of sand and gravel needed over the Plan period, the following formula is used.
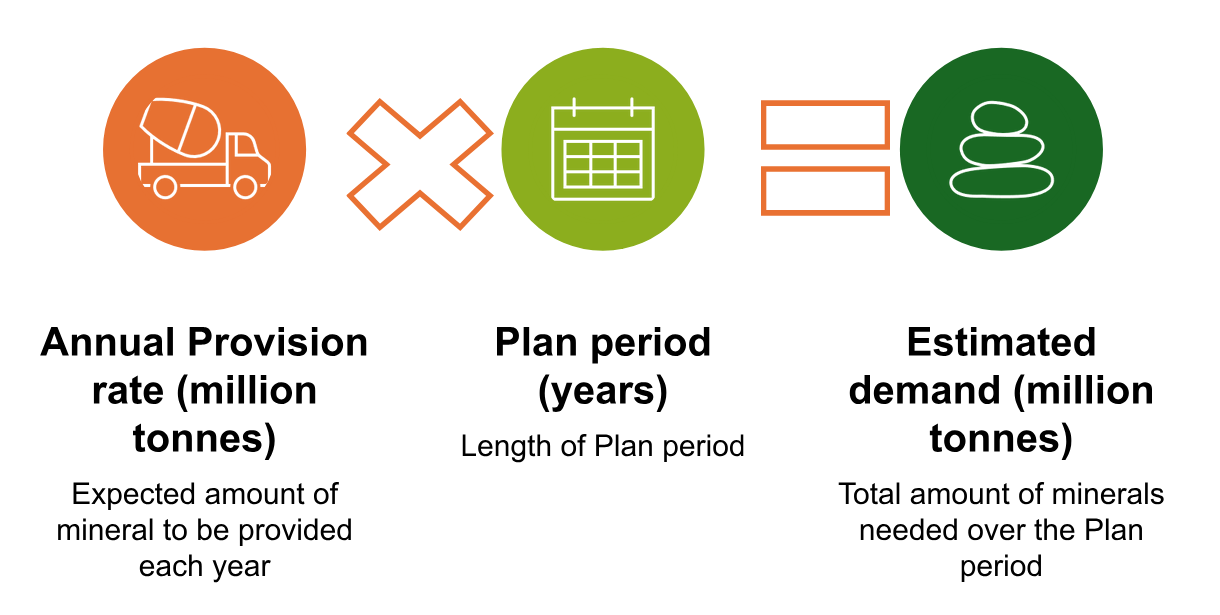
6.20This formula is used in the adopted Plan, which estimates a provision requirement of 32.2 million tonnes of sand and gravel in Nottinghamshire over the plan period of 2018 – 2036 (19 years). This is based upon an annual provision rate of 1.7 million tonnes, which was based upon the 10 – year sales average for sand and gravel in Nottinghamshire and Nottingham from 2007 to 2017.
6.21To calculate the provision required for the new Plan, we must then establish the latest annual provision rate through the latest LAA.
6.22A Draft LAA containing 2025 sales data has been published alongside this scoping consultation which provides the latest information on sales in Nottinghamshire for sand and gravel. It shows that sales have declined since the Plans adoption in 2021, reaching a record low due to:
- The impacts of the COVID – 19 Pandemic
- Unprecedented flooding events
- Uncertainty in the market
6.23As outlined in the Draft LAA (containing 2025 sales data), the Councils have considered other relevant local information. The Draft LAA identifies future large-scale projects that could increase sand and gravel demand over the Plan period.
6.24This has led us to consider whether using the 10 – year sales average as the annual provision rate to forecast future demand is appropriate. We want to ensure the Plan is prepared positively and able to accommodate any future growth, with major development expected over the life of the Plan.
6.25We are therefore proposing three options which could be used as the annual provision rate to forecast future provision for sand and gravel. These options are presented in Table 3.
Table 3: Options for annual provision rate for calculating sand and gravel provision over the new Plan period.
|
Option |
Name |
Annual provision rate based upon |
Annual provision rate (million tonnes) |
|
A |
10 – year sales average |
Sales average from 2016 – 2025 |
1.20 |
|
B |
Alternative sales average |
Sales average from 2016 – 2025 removing 2020, 2023 and 2024 lows |
1.32 |
|
C |
Current provision rate |
Sales average from 2007 – 2016 |
1.70 |
6.26Option A would use the 10-year sales average from 2016 – 2025 as the annual provision rate. Whilst this option reflects past trends, it does include low sales figures caused by unprecedented events and could potentially not plan for future growth.
6.27Option B seeks to acknowledge the impact of unprecedented events in 2020 (the Covid -19 pandemic), 2023 and 2024 (extreme weather leading to extensive flooding in the Trent Valley) on the 10 – year sales average. The annual production rate used in option B is therefore an average taken between 2016 and 2025 with these years removed. This option would plan for some growth in the future whilst being reflective of past trends.
6.28The final option, C, seeks to plan for and be able to accommodate growth by using the current plan annual requirement, which is based on historical trends when sales were higher, albeit still lower than pre-2012 sales.
6.29We are interested in your views on which option may be the most appropriate to use for the annual provision rate, which will then establish the demand as set out in the formula above. This will influence the site selection process as shown in the draft site selection methodology document and how many sites need to be allocated.
Question 12: Of the three options presented, which do you think would be appropriate to use as the annual provision rate for sand and gravel to calculate future demand? Comment
Question 13: Is there any other options we should consider? If so, please provide evidence and justification to support this option. Comment
Meeting demand for sand and gravel
6.30The policy within this section will set out how we intend to meet the identified demand for sand and gravel set out above. We believe this will be similar to Policy MP2 in the current adopted Plan, where the need will be met through:
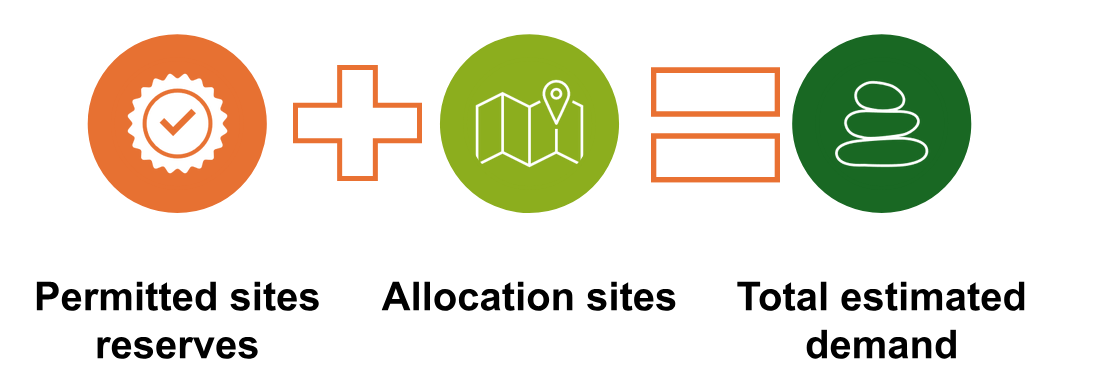
6.31In relation to the permitted reserves, this will be the reserves established at the permitted sites listed in Table 2 of the draft LAA. As noted in the LAA though, some of these sites are currently inactive and for some it is not known when these will re-open. How many sites are required for allocation will depend on the calculated estimated demand and permitted reserves levels. We therefore would be interested to hear your thoughts on how inactive sites should be considered in ensuring we have sufficient supply.
Question 14: How should we consider inactive permitted sites when calculating permitted reserves to ensure we meet the demand for sand and gravel over the Plan period? Comment
6.32The policy will also detail the sites allocated for future sand and gravel extraction, with site specific policies following in the next section. These sites will come from a call for sites exercise, which we expect to yield enough sites, and be identified using the site selection methodology once finalised.
6.33It may also be that the policy outlines how unallocated sites will be handled. This could be a similar approach to Policy SP1, which requires a need to be demonstrated. The policy could note the importance of maintaining landbank, showing compliance with the spatial strategy and ensuring the safeguarding of mineral resource.
Question 15: Should the policy address unallocated sites coming forward in the Plan period? If yes, how so and what should be included? Comment
Sherwood Sandstone
6.34As explained in the LAA, Sherwood sandstone is a specialist sand material used mainly for asphalting and mortar sand and other specialist uses. Since it has a distinctive and separate market in the area, as per clause 2.c. of Policy M1 of the NPPF, we calculate and maintain a separate landbank for Sherwood sandstone. As it is a specialist sand and gravel, the required landbank is also 7 years.
Establishing Sherwood Sandstone demand
6.35To plan for future need, the same formula is applied as to Sherwood Sandstone to calculate the required provision over the Plan period.
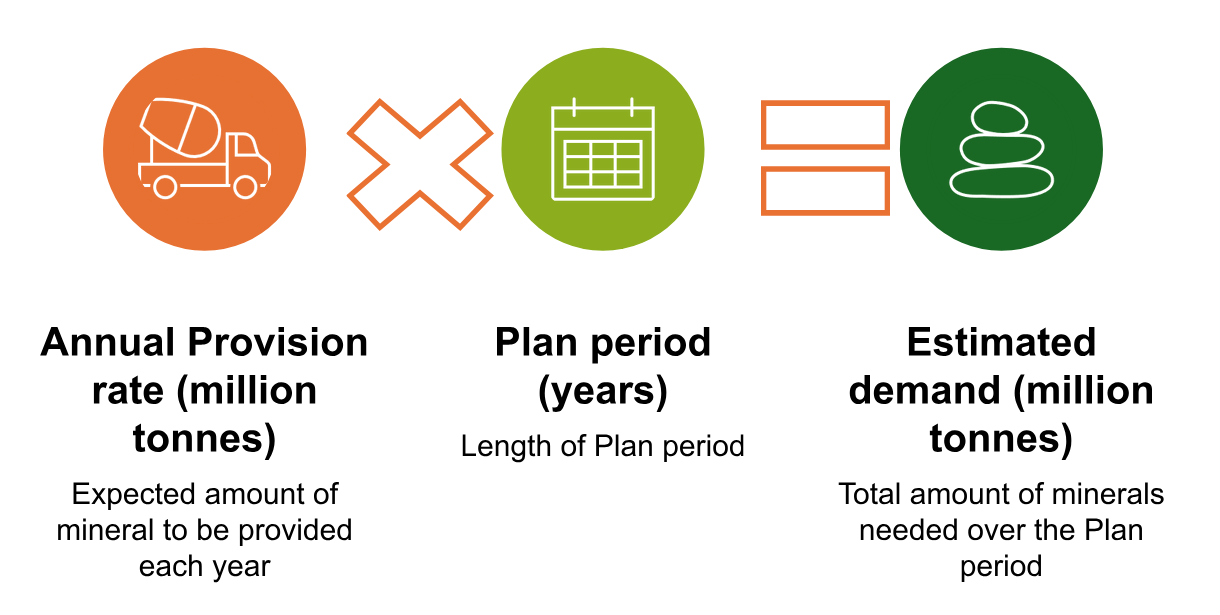
6.36In the adopted Plan, using the 10 – year sales average from 2007 - 2016 as the annual provision rate (0.37 million tonnes) this estimated a demand of 7.03 million tonnes over the 19-year plan period (0.37 x 19 = 7.03 million tonnes).
6.37As discussed in the draft LAA, sales for Sherwood sandstone remained relatively stable until 2020 when the impact of the pandemic can be clearly seen. The market experienced a slow recovery in the following years, though reached a high peak in sales in 2024 which raised the 3 – year sales average.
6.38Considering this local information and the 3 – year sales trend, we are debating whether the 10 – year average sales figure is an appropriate annual provision rate in which to forecast demand for the new Plan. We are proposing three options for the annual provision rate to calculate Sherwood Sandstone demand which are set out in Table 4.
6.39The options include using the 10 – year sales average, though we recognise that this reflects the impact of the unprecedented COVID 19 pandemic, which is why an alternative average option is presented (option b). This removes the low 2020 sales figure from the average.
6.40It is also recognised that the current 3 – year average is above both potential provision rates, at 0.37 million tonnes which reflects the current Plans provision rate. We therefore are also considering using this provision rate as an option.
6.41We would be interested to hear your views on what the most appropriate annual provision rate may be to calculate future provision and demand for Sherwood Sandstone to ensure the Plan is ensuring a sufficient supply of minerals.
Table 4: Options for annual provision rate for calculating Sherwood Sandstone provision over the new Plan period.
|
Option |
Name |
Annual provision rate based upon |
Annual provision rate (million tonnes) |
|
A |
10 – year sales average |
Sales average from 2016 – 2025 |
0.32 |
|
B |
Alternative sales average |
Sales average from 2016 – 2025 removing 2020 low) |
0.34 |
|
C |
3 – year sales average |
Sales average from 2023 – 2025 |
0.37 |
Question 16: Of the three options presented, which do you think would be appropriate to use as the annual requirement figure for Sherwood Sandstone to calculate the required provision? Comment
Question 17: Is there any other options we should consider? If so, please provide evidence and justification to support this option. Comment
Meeting demand for Sherwood Sandstone
6.42The policy within this section will set out how we intend to meet the identified demand for Sherwood Sandstone set out above.
6.43We believe this will be similar to Policy MP3 in the current adopted Plan, where the need will be met through:
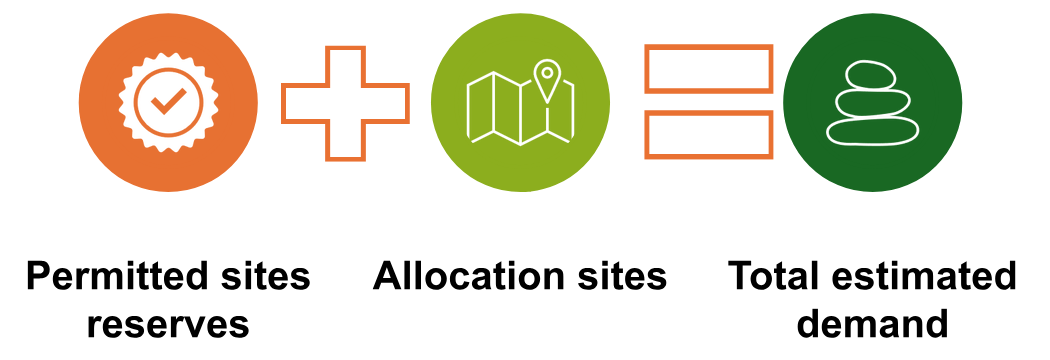
6.44In relation to the permitted reserves, this will be the reserves established at the permitted sites listed in Table 5 of the draft LAA. As noted in the LAA though, one site is currently inactive. How many sites are required for allocation will depend on the calculated estimated demand and permitted reserves levels. We therefore would be interested to hear your thoughts on how inactive sites should be considered in ensuring we have sufficient supply.
Question 18: How should we consider inactive permitted sites when calculating permitted reserves to ensure we meet the demand for Sherwood Sandstone over the Plan period? Comment
6.45The policy will also detail the sites allocated for future Sherwood sandstone extraction, with site specific policies following in the next section. These sites will come from a call for sites exercise which will be filtered using the site selection methodology once finalised.
6.46It may also be that the policy outlines how unallocated sites will be handled. This could be a similar approach to Policy SP1, which requires a need to be demonstrated. The policy could note the importance of maintaining landbank, showing compliance with the spatial strategy and ensuring the safeguarding of mineral resource.
Question 19: Should the policy address unallocated sites coming forward in the Plan period? If yes, how so and what should be included? Comment
Crushed rock
6.47Crushed rock resource is limited to the western area of Nottinghamshire, with larger resource and sites found in neighbouring Derbyshire. The NPPF requires authorities to maintain a 10 – year landbank.
Establishing crushed rock demand
6.48Like sand and gravel and Sherwood Sandstone, the forecast for demand is calculated in the same way:
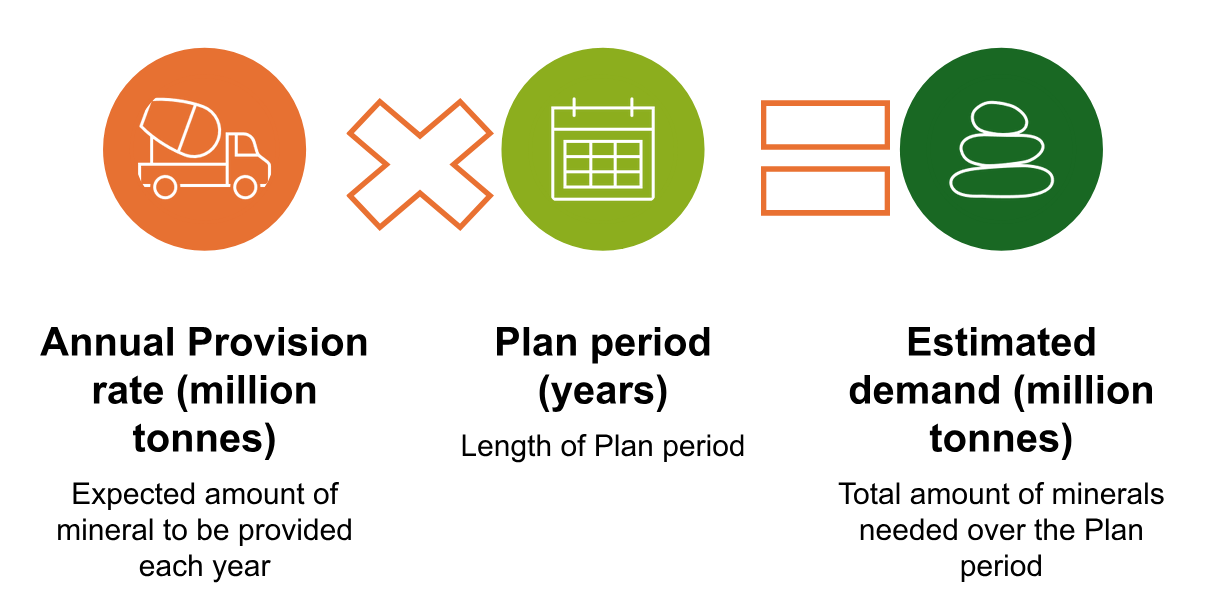
6.49In the current adopted plan, the annual provision rate used to estimate required demand over the Plan period of 19 years is taken from the 10 – year sales average from 2007 – 2016 (0.05 million tonnes). This provided an estimated demand of 0.095 million tonnes.
6.50However, as explained in the LAA, the only permitted quarry in Nottinghamshire has now been dormant for over 10 years, meaning there have been no sales of crushed rock locally.
6.51This does not mean though that there is no demand for crushed rock in Nottinghamshire. The 2019 and 2023 national aggregate survey show that we import crushed rock instead, primarily from the neighbouring authorities of Derbyshire and Leicestershire.
6.52Without sales to provide an annual provision rate to calculate demand, we have suggested one option as shown in Table 5 where the rate is calculated taking an average of imports from the 2019 and 2023 national aggregate survey. We would welcome your views on whether this is an appropriate basis for forecasting future need for crushed rock or whether there any alternative approaches.
Table 5: Option for annual provision rate for calculating crushed rock provision over the new Plan period.
|
Option |
Name |
Annual provision rate based upon |
Annual provision rate (million tonnes) |
|
A |
National survey average |
Average of imports of crushed rock into the plan area from the 2019 and 2023 national aggregate survey |
1.05 |
Question 20: Do you agree with using option A as the provision rate to calculate crushed rock demand? Are there any other options we should consider? If so, please provide evidence and justification to support this option. Comment
Meeting demand for crushed rock
6.53The policy within this section will set out how we intend to meet the identified demand for crushed rock set out above. This would be met through:
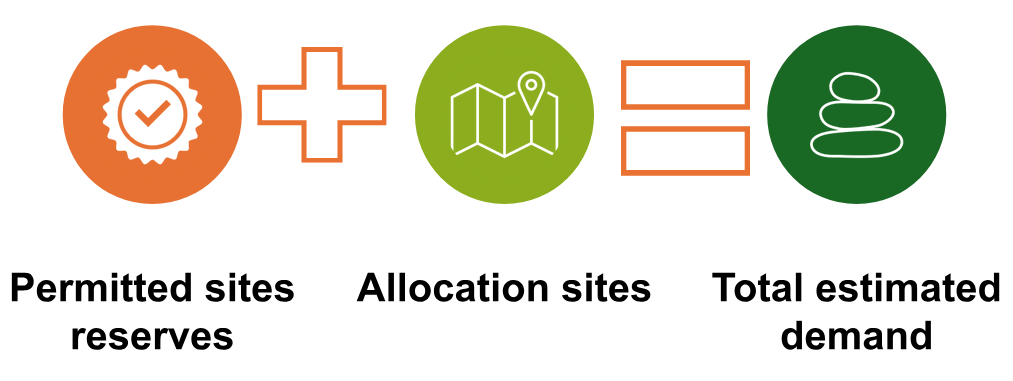
6.54It is though noted that the 3.34 million tonnes of permitted reserves at Nether Langwith have not been active for 18 years. Again, we would be interested in how we should consider this permitted reserve when considering how many sites, if any are submitted, need to be allocated to meet demand.
Question 21: How should we consider inactive permitted sites when calculating permitted reserves to ensure we meet the demand for crushed rock over the Plan period? Comment
6.55If no further sites for crushed rock are submitted in the call for sites, it may not be possible to allocate any sites. We would anticipate that in this instance, the policy would need to be flexible to allow for sites to come forward which can demonstrate a need and compliance with the spatial strategy. The site would also need to satisfy any local policies and national decision – making policies within the NPPF.
Question 22: If no sites are submitted for allocation, would you be supportive of a flexible policy to allow sites to come forward as required? Comment
Brick clay
6.56There are currently two established brickworks in Nottinghamshire at Dorket Head and Kirton, both with active extraction areas.
Establishing and meeting demand for brick clay
6.57The NPPF outlines that for brick clay a landbank of at least 25 years should be maintained where this is needed to support a kiln. Policy M1 also outlines the demand for brick clay in the area should be based upon evidence of existing capacities and demand. To understand the need to maintain a supply of brick clay, we would therefore be reliant upon the mineral operators to provide this information.
6.58The policy for brick clay will therefore identify the need and outline how this will be met, similar to the current Policy MP6 in the adopted Plan.
6.59Preferably, the policy will include allocations to secure this supply. If no sites are put forward, the policy would then seek to be flexible, allowing sites to come forward where a need can be demonstrated.
Question 23: Can you provide any information and evidence that could help establish the need for brick clay over the Plan period? Comment
Question 24: Do you support our approach to establishing and meeting demand for brick clay? If not, please provide an explanation and alternative options. Comment
Gypsum
6.60Two gypsum resources are currently worked in Nottinghamshire at East Leake and Bantycock, near Newark.
Establishing and meeting demand for gypsum
6.61There is no national forecast or requirement to maintain a landbank for gypsum. Therefore, to understand the need for further reserves we are reliant upon the operator, British Gypsum to inform us of requirements.
6.62Through discussion with British Gypsum, the policy for gypsum will identify the need, current extraction sites and then identify any further sites required through allocated site or sites. This is similar to the approach taken in Policy MP7 of the adopted Minerals Local Plan.
6.63The policy could also maintain the current flexibility of Policy MP7 to allow other sites to come forward where a need can be demonstrated.
Silica Sand
6.64Currently extracted from one site in Nottinghamshire, this is specialist industrial sand which has wide ranging specialist uses. This makes it an important mineral with a national market.
Establishing and meeting demand for silica sand
6.65There is no national forecast or way to calculate demand for silica sand and so the councils are reliant upon the industry identifying a need for further resources. The NPPF does require though a 10 – year landbank to be maintained at individual silica sand sites.
6.66By working with operators and their feedback, the policy for establishing and meeting demand for silica sand will identify demand and allocate sites, if put forward and appropriate, to meet this need.
6.67The policy could also maintain the current flexibility of Policy MP8 to allow other sites to come forward where a need can be demonstrated.
Question 27: Can you provide any information and evidence that could help establish the need for silica sand over the Plan period? Comment
Question 28: Do you support the approach to establishing and meeting demand for silica sand? If not, please provide an explanation and alternative options. Comment
Industrial dolomite
6.68Currently no industrial dolomite is worked in Nottinghamshire, but it is an important national industrial grade limestone.
Establishing and meeting demand for industrial dolomite
6.69There is no national forecast or way to calculate demand for industrial dolomite and so the councils are reliant upon the industry identifying a need for further resources. We therefore will work with the mineral industry to understand any demand for industrial dolomite and need for additional sites.
6.70If any sites are put forward by mineral operators, these will be allocated where appropriate. If there are no allocations, the policy will be similar to the current adopted policy MP9 which supports proposals for extraction where a need can be demonstrated.
Question 29: Can you provide any information and evidence that could help establish the need for industrial dolomite over the Plan period? Comment
Question 30: Do you support the approach to establishing and meeting demand for industrial dolomite? If not, please provide an explanation and alternative options. Comment
Building stone
6.71Building stone is an important mineral which helps preserve the local character and the historic environment. There currently is one permitted site for building stone extraction in Nottinghamshire near Linby.
Establishing and meeting demand for building stone
6.72There is no national forecast or way to calculate demand for building stone and so we are reliant upon the industry identifying a need for further resources. We therefore will work with the mineral industry to understand any demand for building stone and need for additional sites.
6.73If any sites are put forward by mineral operators, these will be allocated where appropriate. If there are no allocations, the policy will be similar to the current adopted policy MP10 which safeguards the permitted Yellowstone site and supports proposals for extraction where a need can be demonstrated.
Question 31: Can you provide any information and evidence that could help establish the need for building stone over the Plan period? Comment
Question 32: Do you support the approach to establishing and meeting demand for building stone? If not, please provide an explanation and alternative options. Comment
Oil and gas
6.74Unlike the above minerals, as per clause 4 of Policy M1 of the NPPF, plans are required to distinguish between, and plan for, the three phases of development within licenced areas. They include:
- Exploration
- Appraisal and
- Production
6.75It is therefore anticipated that the plan will contain a policy similar to the Nottinghamshire Minerals Local Plan Policy MP12: Oil and gas and Nottingham LPP2 DPD policy MI3: Hydrocarbons which plans for these three phases. Though the policy will need to state that proposals will only be supported in licenced areas.
6.76The policy may also allocate any sites for development if sites are submitted by operators and deemed appropriate. Again, these sites will only be included if they fall within a licenced area.
Question 33: Do you support the policy approach to oil and gas? If not, please provide an explanation and alternative options. Comment
[2] Required by clause 2.b of Policy M1 in the NPPF.


