
Waste Issues and Options
4. Waste Management in the Plan Area
4.1. One of the biggest problems in planning for waste are the many uncertainties over how much waste is produced, how and where it is managed, and what might happen in the future. We have reliable data for municipal waste but, local data for other waste is often out of date and based on regional or national estimates.
4.2. The Councils have prepared a preliminary Waste Needs Assessment (WNA) document to accompany this consultation. This sets out current waste arisings, forecasts of future waste arisings, existing waste management capacity and estimates of any potential shortfalls in future waste management capacity. We also welcome any comments on this.
Current waste production
4.3. The most recent estimates suggest that around 2.5 million tonnes of waste are produced across the plan area each year. This comes from a variety of sources including Local Authority Collected (Municipal) Waste from households and schools; commercial and industrial waste from shops, offices and factories; and construction, demolition and excavation wastes such as rubble and soils. Other sources of waste include wastewater and sewage, agricultural waste, and mining wastes. In the past, large quantities of ash were also produced from coal-fired power stations, but these are due to be phased out.
Figure 4 –Waste produced in the Plan Area 2018
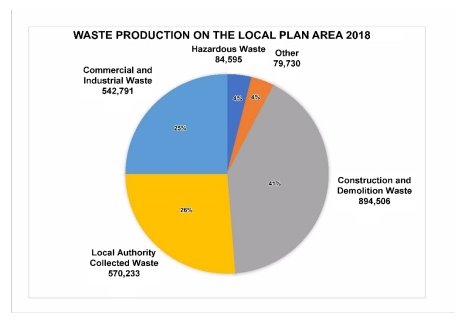
Source: Defra and Environment Agency Waste Data Interrogator 2018
(11) Q3: Do you agree with the current waste estimate? Do you have any other information which may lead to a different waste estimate?
What happens to our waste?
4.4. In order to asses future waste management options, we first need tounderstandhow and where our waste is currently managed.
Local Authority Collected Waste (LACW)
4.5. Since the publication of the Waste Core Strategy recycling rates have slowed and, in some cases, fallen. In 2017/18 recycling rates within the City were at 30% and within Nottinghamshire 45%. Across the Plan area, the average is 41%.
4.6. More of our waste is now recovered for energy with approximately 60% of Nottingham's waste, and 50% of Nottinghamshire's waste sent for energy recovery. This equates to 52% across the Plan area.
4.7. Very little of our waste is now sent to landfill with less than 10% of waste disposed of to landfill each year. Most of this waste is residual waste that cannot be recovered or recycled.
Commercial and Industrial Waste (C & D)
4.8. Less information is available for commercial and industrial waste, but national estimates suggest that at least 52% of this waste is recycled.
Construction, Demolition and Excavation Waste (C, D & E)
4.9. Information on construction, demolition and excavation waste is also very limited. A large proportion is re-used on site, and is therefore not recorded, meaning there is very little information about how and where it is managed. National and regional estimates suggest that up to 90% of this waste is recycled or reused in engineering, landscaping and restoration projects, but there are no local estimates available.
Other wastes
4.10. Waste water and sewage from households and manufacturing processes is managed through a network of treatment facilities operated by Severn Trent. The Councils will work with Severn Trent to identify whether additional treatment capacity may be required to cope with the planned increases in housing and other development. Other specific sources of waste, including agricultural waste and mining waste, are considered in more detail within the accompanying Waste Needs Assessment. These wastes tend to arise in relatively small quantities and are capable of being managed at existing facilities. They are not therefore expected to raise any significant issues for the new Waste Local Plan.
Hazardous Waste
4.11. Hazardous waste can come from any of these sources but needs to be treated separately because of the extra risks it can pose to health or the wider environment. Most of this waste is sent for treatment and recovery, often outside of the Plan area due to the specialist nature of the facilities required.
(17) Q4: Do you have any other information about how these waste streams are managed? Are there other issues the Plan should consider?
What will happen to our waste in the future?
4.12. To ensure we have enough waste management capacity available over the plan period we also need to understand how much waste is likely to be produced in future. Past trends can provide a guide to future waste arisings, but the total amount of waste produced can fluctuate over time, particularly in line with economic circumstances. Over the last five years, the total amount of waste peaked at over 3 million tonnes but has since remained fairly stable at around 2.5 million tonnes per annum.
Figure 5 – Waste Production 2014 to 2018
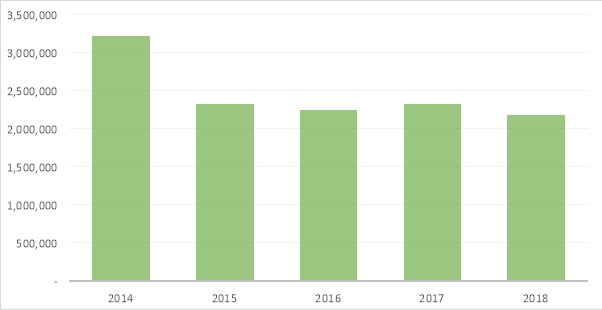
Source: EA and Defra
4.13. Over the next 20 years there is expected to be significant growth in our economy, population and housing. Alongside planned new shops and offices, more than 80,000 new homes will be built. The second phase of HS2 is also planned during the latter part of the plan period with services scheduled to begin in 2033. This planned growth and development has the potential to increase the total amount of waste produced.
4.14. To try and anticipate future needs, we have modelled a range of different scenarios for each waste stream based on current Government advice. These are set out below.
Local Authority Collected Waste (LACW)
4.15. To estimate how much local authority waste from households is likely to be produced in future the Councils have prepared a 'growth profile' which looks at both the expected number of new households and the average amount of waste produced per household over the last five years. Different scenarios have been modelled to consider different possible rates of growth or decline in the amount of waste produced per household as follows:
A) Declining growth – this option assumes an ongoing (i.e. year on year) 0.5% reduction in the amount of waste produced per household. This reflects greater social awareness of waste issues and the impacts of ongoing waste minimisation measures set out in the Government's 25 Year Environment Plan and Waste and Resources Strategy. Under this scenario the total amount of household waste produced would increase to around 516,000 tonnes per year by the end of the plan period. Although the amount of waste produced by each household would reduce, the total tonnage of waste produced would still increase due to the overall increase in the number of households.
B) No change – this option assumes that the amount of waste produced by each household will remain stable over the life of the plan i.e. 0% growth. This scenario therefore only takes account of the increased number of households and does not make any allowance for changes in consumer behaviour and/or waste minimisation. The total amount of household waste produced would increase to 566,000 tonnes per year by 2038.
C) Low growth – this option assumes an annual 0.5% increase in the amount of waste produced per household to reflect an increase in both the amount of waste produced and in the total number of households. This is intended to reflect the possible effects of economic growth and increased household consumption. Waste minimisation and environmental awareness would help to limit the amount of growth but would not offset the effects of greater consumption. This scenario would see an increase to 630,000 tonnes of household per year by 2038.
D) High growth – this option assumes an annual 1.0% increase in the amount of waste produced per household. This is intended to reflect higher rates of household consumption with waste minimisation measures having less impact. This scenario would see an increase to 695,000 tonnes of household waste per year by 2038.
N.B. although some local councils also collect trade waste from shops and businesses, this is a relatively small tonnage and is unlikely to be affected by changes in the rate of household waste growth. Trade waste is not therefore included within these estimates and the Councils will seek views separately on how to take account of likely future trade waste arisings.
(14) Q5: Do you agree with the scenarios set out for Local Authority Collected Waste (LACW)? Which scenario do you consider to be the most suitable on which to base the Plan? Do you have any evidence to support any other scenarios?
Commercial and Industrial Waste (C & I)
4.16. Following Government advice, it is assumed that there will be some growth in the amount commercial and industrial waste produced over the life of the plan – even allowing for the waste minimisation measures outlined in the Government's national Waste and Resources Strategy. Three different scenarios have therefore been modelled to take account of different levels of economic growth.
A) Low growth – this option assumes a 1.0% annual increase in the amount of waste produced. This reflects a lower level of economic growth across the plan area and/or the successful implementation of wider waste minimisation measures such as manufacturer and retailer 'take-back' schemes for end of life products such as those already in place for waste electrical items. This would see an increase in the total amount of waste produced to just under 740,000 tonnes per year by 2038.
B) Medium growth – this option assumes a 2.0% annual increase in the amount of waste produced. This reflects a higher rate of economic growth across the plan area. This would see an increase in the total amount of waste produced to 900,000 tonnes per year by 2038.
C) High growth – this option assumes a 3.4% annual increase in the amount of waste produced. This reflects the current rate of growth in GVA (Gross Value Added - which is the measure of value of goods and services produced in an area, industry or sector of the economy) across the East Midlands[2] .This would see an increase in the amount of waste produced to almost 1.2 million tonnes per year.
(11) Q6: Do you agree with the scenarios set out for Commercial and Industrial (C & I) Which scenario do you consider to be most suitable on which to base the Plan? Do you have any evidence to support any other scenarios?
Construction, Demolition and Excavation Waste (C, D & E)
4.17. Government advice is to assume that there will be no growth in the amount of construction wastes unless there are major infrastructure, engineering or redevelopment proposals expected within the plan area. For this reason, we have modelled three different scenarios reflecting different rates of construction activity over the life of the plan.
A) No change – this is the default option which assumes there will be 0% growth in the amount of waste produced each year due to existing high levels of prevention and re-use and no significant change in the rate of construction and development. This would see the amount of waste remain stable at just over 1.3 million tonnes per year throughout the life of the plan.
B) Low growth – this option assumes that there will be a continued 1.0% growth in the amount of waste produced each year. This is intended to reflect additional construction activity as a result of HS2 and planned redevelopment in Nottingham City Centre. This would see the amount of waste increase to just under 1.6 million tonnes each year by 2038.
C) Medium/High growth – this option assumes that there will be a continued 2.0% growth in the amount of waste produced each year. This reflects a higher rate of economic growth as well as existing planned development. This would see the amount of waste produced increase to around 1.9 million tonnes each year by 2038.
(11) Q7: Do you agree with the scenarios set out for Construction, Demolition and Excavation Waste (CDE)? Which scenario do you consider to be most suitable on which to base the Plan? Do you have any evidence to support any other scenarios?
Hazardous Waste
4.18. Government advice is to plan for future hazardous waste arisings on the basis of a simple timeline projection. As there has been significant fluctuation in hazardous waste arisings over time, the Councils have used the last ten years as the basis from which to project forwards. This gives a figure of just under 95,000 tonnes of hazardous waste each year by 2038.
(8) Q8: Do you agree with the estimate set out for Hazardous Waste? Do you have any evidence to support any other scenarios?
What assumptions should we make about how waste will be managed in future?
4.19. In order to estimate/understand the amounts and types of waste management facilities that might be needed we also have to look at the likely changes in how waste will be managed in future.
4.20. It is important to remember that the Waste Local Plan is a land-use document that is focussed on the facilities needed to process, treat and ultimately dispose of waste, once it has been produced. The Plan itself cannot influence wider waste prevention measures but is meant to ensure that there are suitable facilities to recycle, recover and finally dispose of waste once all other options have been exhausted.
4.21. Recycling rates for local authority collected waste (LACW) are expected to increase as all authorities are likely to be required to collect food waste. However, the introduction of a national-deposit return scheme for plastic and glass drinks bottles and aluminium cans could divert materials from local authority collection schemes into commercial recycling schemes. Recycling rates for commercial and industrial waste should also increase as further manufacturer take back schemes are introduced, and companies are encouraged to refurbish/repair rather than throw away. Possible barriers to higher recycling rates will include the amount of local authority funding/private sector investment available and the willingness of residents, manufactures and retailers to participate in recycling schemes. As there are already very high levels of re-use and recycling for construction wastes, it is assumed that this will continue.
4.22. Future recycling rates are therefore difficult to quantify but it is assumed that rates for both LACW and commercial and industrial wastes will increase by at least 10% above current levels by 2038. The current rate of recycling across the plan area is 41%.
(13) Question 9: Do you consider these assumptions about future recycling rates are an appropriate basis for the Waste Local Plan. Do you have any evidence to suggest that different assumptions should be made?
4.23. Where waste cannot be recycled, using it as a source of energy can provide benefits in terms of generating heat and power. This is more sustainable than simply disposing of the waste and can help to offset fossil fuel use. However, this can raise concerns over the appropriate size of facilities to ensure that they do not 'compete' with recycling facilities by locking waste in to long-term contracts. Currently the UK exports large quantities of residual waste as Refuse Derived Fuel (RDF) to countries in mainland Europe where it is burned for energy. With the UK leaving the EU, the waste industry expects there to be more demand to process and manage this waste as a resource within the UK. Nottinghamshire and Nottingham currently has 750,000 tonnes of permitted annual energy recovery capacity but only 185,000 of this is operational.
(16) Q10: What role do you think recovery should play? Should the plan provide for higher levels of energy recovery in future?
4.24. Waste disposal, through either landfill or incineration without energy recovery, is at the very bottom of the waste hierarchy. However, there is always likely to be some waste that cannot be further recycled or recovered and that will need to be disposed of safely. This is only expected to be a relatively small amount of remaining waste from other treatment processes, but the Plan will still need to consider how to manage this waste. Disposal rates for local authority collected waste and commercial and industrial waste have fallen significantly over the last 10 years but there is now only one suitable landfill site within the Plan area which is due to close within a year. After this, waste for disposal will have to be sent to sites outside the plan area unless a new local site can be found.
4.25. Disposal rates for inert (mostly construction and demolition) waste are expected to remain at similar levels given the existing high levels of re-use and recycling. Although existing disposal capacity is higher for this type of waste, this is largely concentrated within a single large site. Additional capacity may therefore be needed to provide more local sites and reduce the impacts of transporting this waste.
4.26. It is therefore assumed that the plan will need to maintain at least some landfill disposal capacity for all waste types.
(14) Q11: Do you agree with the need to provide additional disposal capacity within the Plan Area?
[2] The Local Economic Partnership (D2N2) is currently preparing a Local Industrial Strategy which may include different targets. This will be kept under review.